How I Used Dynamic Programming to Optimize Classroom Ventilation
Classroom Ventilation
In winter, opening windows in a classroom is hard. Open them and fresh air comes in, the CO₂ level drops. But the classroom gets cold. Keep them closed and it stays warmer, but the CO₂ concentration climbs too high. That was the trade-off I had to study.
This was the problem I studied in my mathematical modeling competition paper. The title of my paper was Dynamic Changes of Carbon Dioxide Concentration in Classrooms and Optimization of Ventilation Strategies.
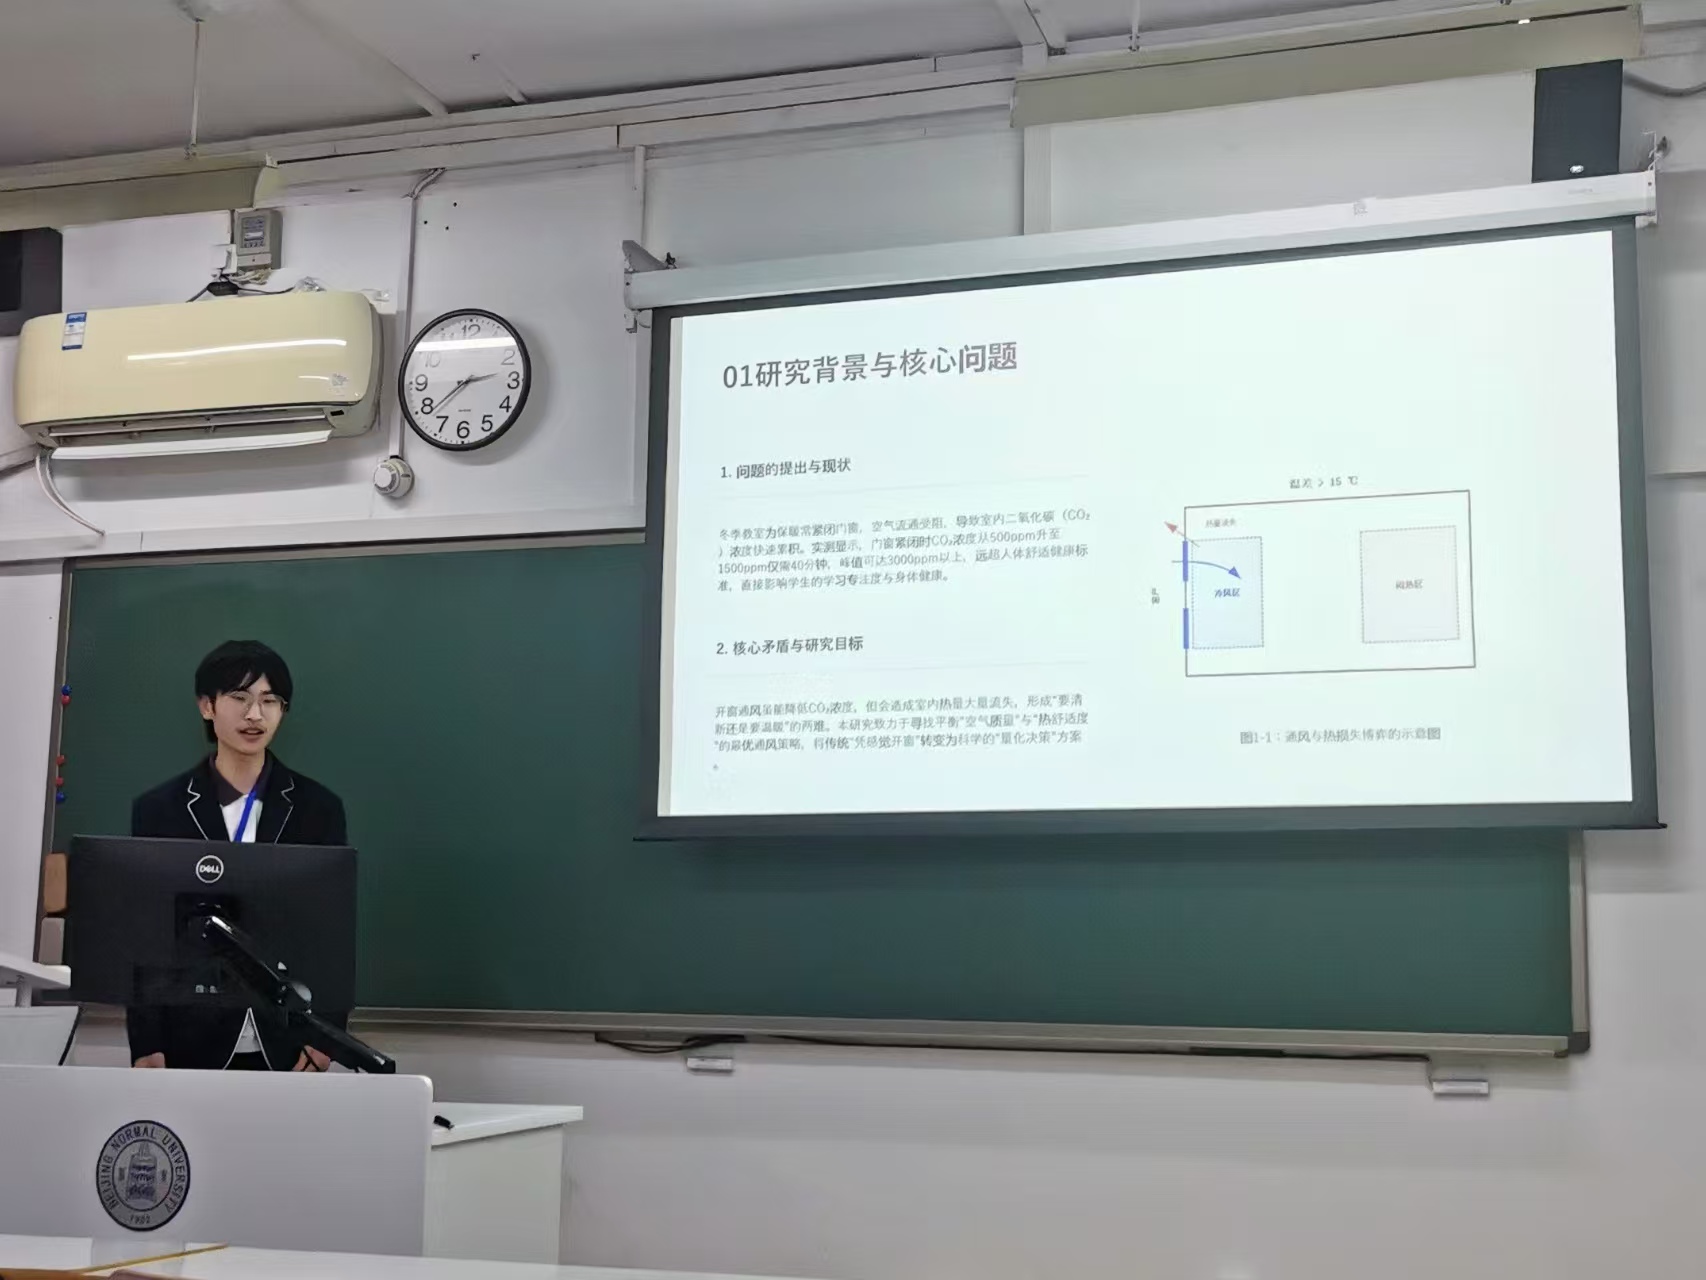
Figure 1: Research background: Classroom CO₂ accumulation and winter heat trade-off.
To get real numbers instead of guessing, I set up a CO₂ sensor module on a desk in our classroom. I mounted the sensor on a small tripod at student breathing height, plugged it into a power bank, and recorded the concentration every few minutes across the day.
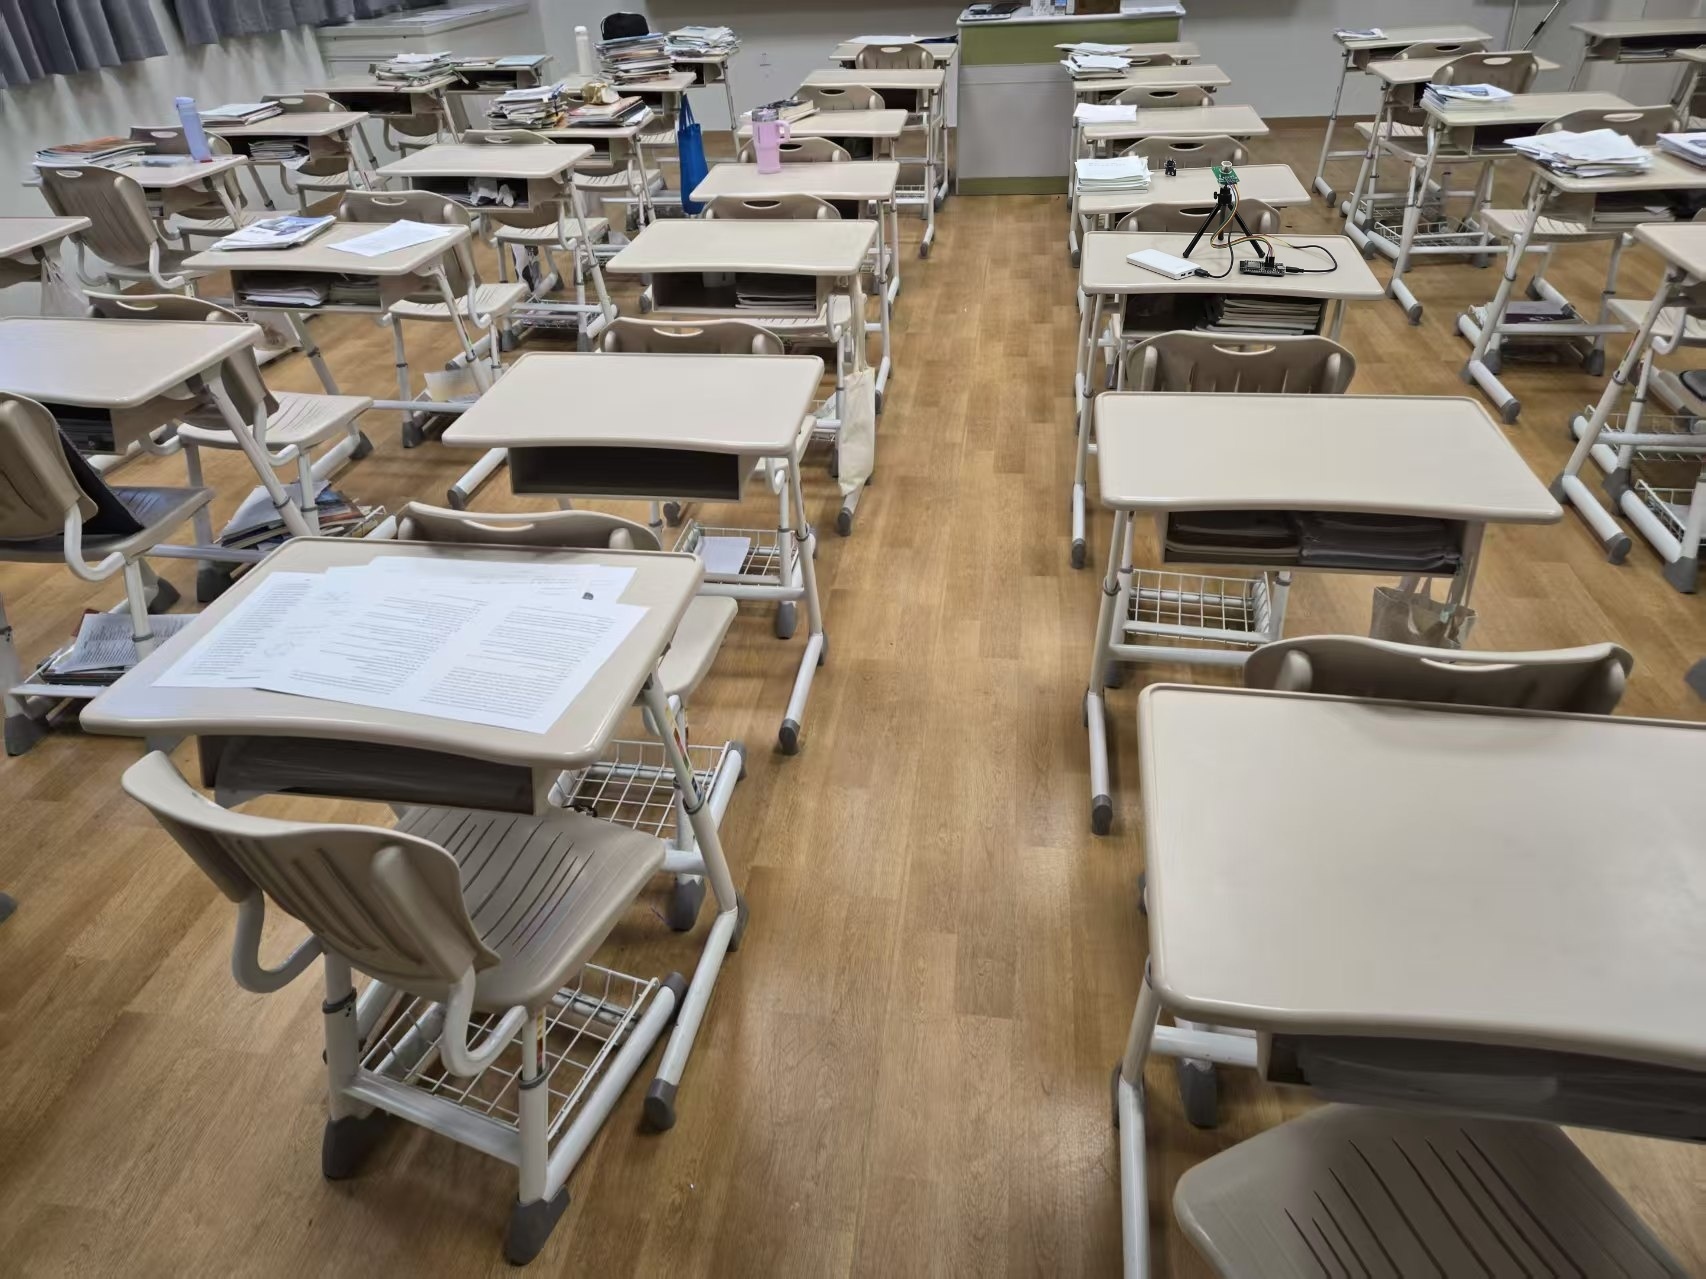
Figure 2: Real-world CO₂ sensor deployment at student breathing height in our classroom.
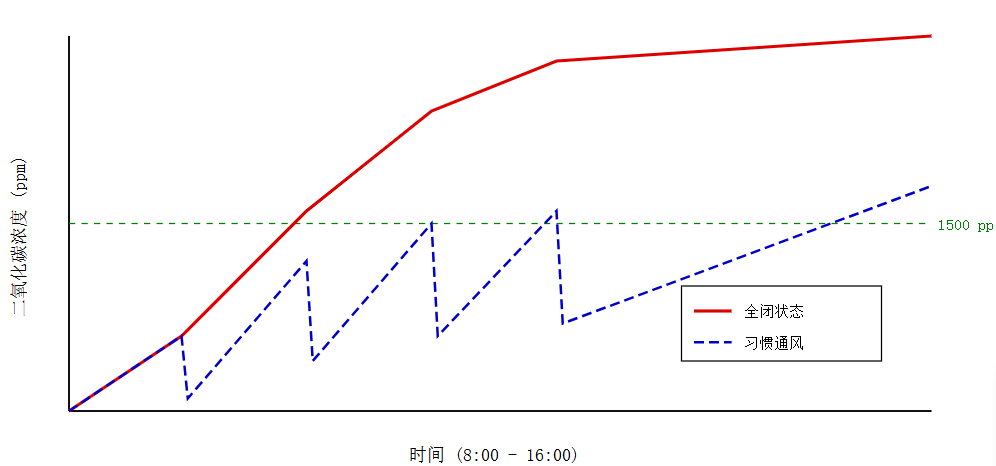
Figure 3: Measured CO₂ concentration curve in a closed classroom setting.
- Vertical axis (纵轴): CO₂ Concentration (ppm) / 二氧化碳浓度 (ppm)
- Horizontal axis (横轴): Time (8:00 to 16:00) / 时间 (8:00至16:00)
- Red solid line (全闭状态): Fully closed state
- Blue dashed line (习惯通风): Habitual intermittent ventilation
- Green dashed line (1500 ppm): Recommended comfort threshold limit
How I Started
I joined the contest during winter vacation. The first round was an ability test. We had to answer questions that tested our modeling skills: how to use math on problems from daily life.
For example, one question asked why fallen leaves fall at different speeds in similar conditions. Another was about arranging orders in an operation process. Different problems, but they all asked us to find the important variables, make reasonable assumptions, and use math to analyze them.
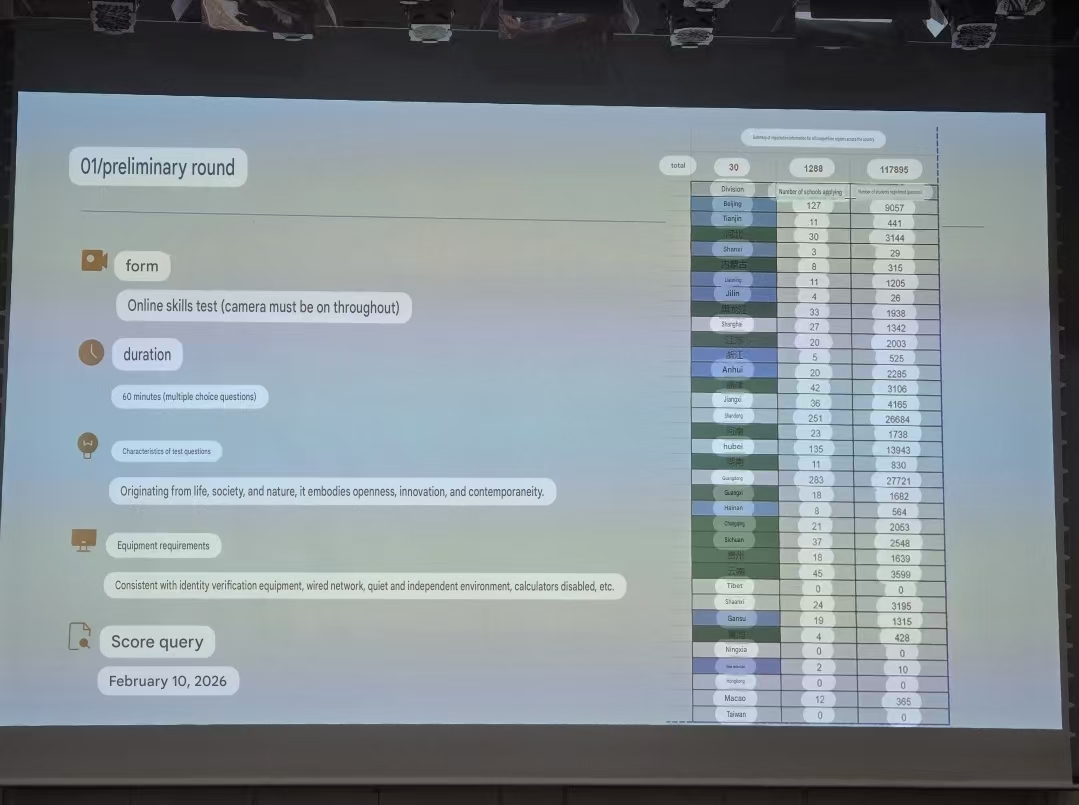
Figure 4: Preliminary round evaluation records and selection statistics.
I received a First Prize in the preliminary round. Then I entered the next round, where I needed to write a complete modeling paper.
My Research Question
For the semifinal, I decided to study the air quality in classrooms.
We spend hours in that room every day. With everyone breathing, the CO₂ level climbs. If nobody opens a window, it gets high. I thought it might affect how comfortable and how focused people felt in class.
But it was winter when I was doing this project. Opening windows could reduce CO₂ concentration, but it could also make the classroom colder. So I needed to consider two things at the same time:
The CO₂ concentration should not be too high.
The classroom temperature should not be too low.
My goal was to find a better ventilation strategy during a school day.
Building the Model
First, I built a model to describe how the CO₂ concentration and indoor temperature changed over time.
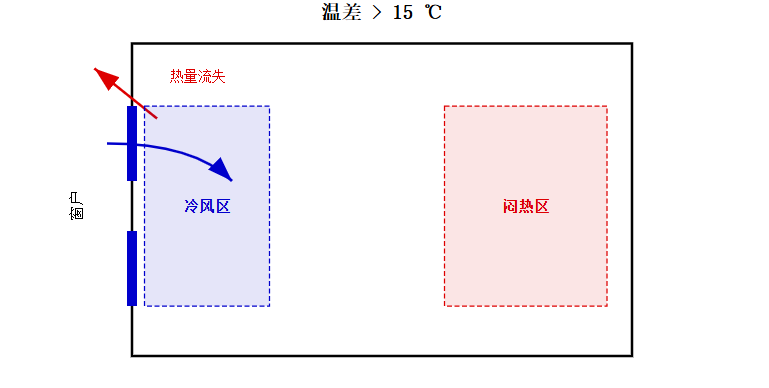
Figure 5: Spatial contradiction model between cold-draft perimeter and stagnant interior.
- Top condition (温差 > 15 ℃): Outdoor-indoor temperature difference > 15 °C
- Left label (窗户): Classroom windows
- Red arrow (热量流失): Heat loss through open windows
- Blue dashed zone (冷风区): Cold-draft zone near open windows
- Pink dashed zone (闷热区): Stagnant stuffy zone in classroom interior
With students inside, CO₂ went up. Open a window and fresh air came in, so it went back down. But opening windows lost heat, especially in winter.
I set different rules for class time, short breaks, and longer breaks. Opening a window during a break makes more sense than opening it during class.
To measure the comfort of the classroom, I designed two penalty functions:
A CO₂ penalty, which became higher when the CO₂ concentration was too high.
A temperature penalty, which became higher when the classroom temperature was too low.
Then I combined the two penalties into one total penalty function. The best ventilation strategy should make the total penalty as small as possible.
Using a Questionnaire
One difficult part was deciding the weights of CO₂ concentration and temperature.
Some people want fresh air more, some people want to stay warm more. I did not want to pick the weights just from my own opinion.
So I designed a questionnaire. I used the results to decide how important temperature and air quality were in the model. This made the model closer to people's real feelings in a classroom.
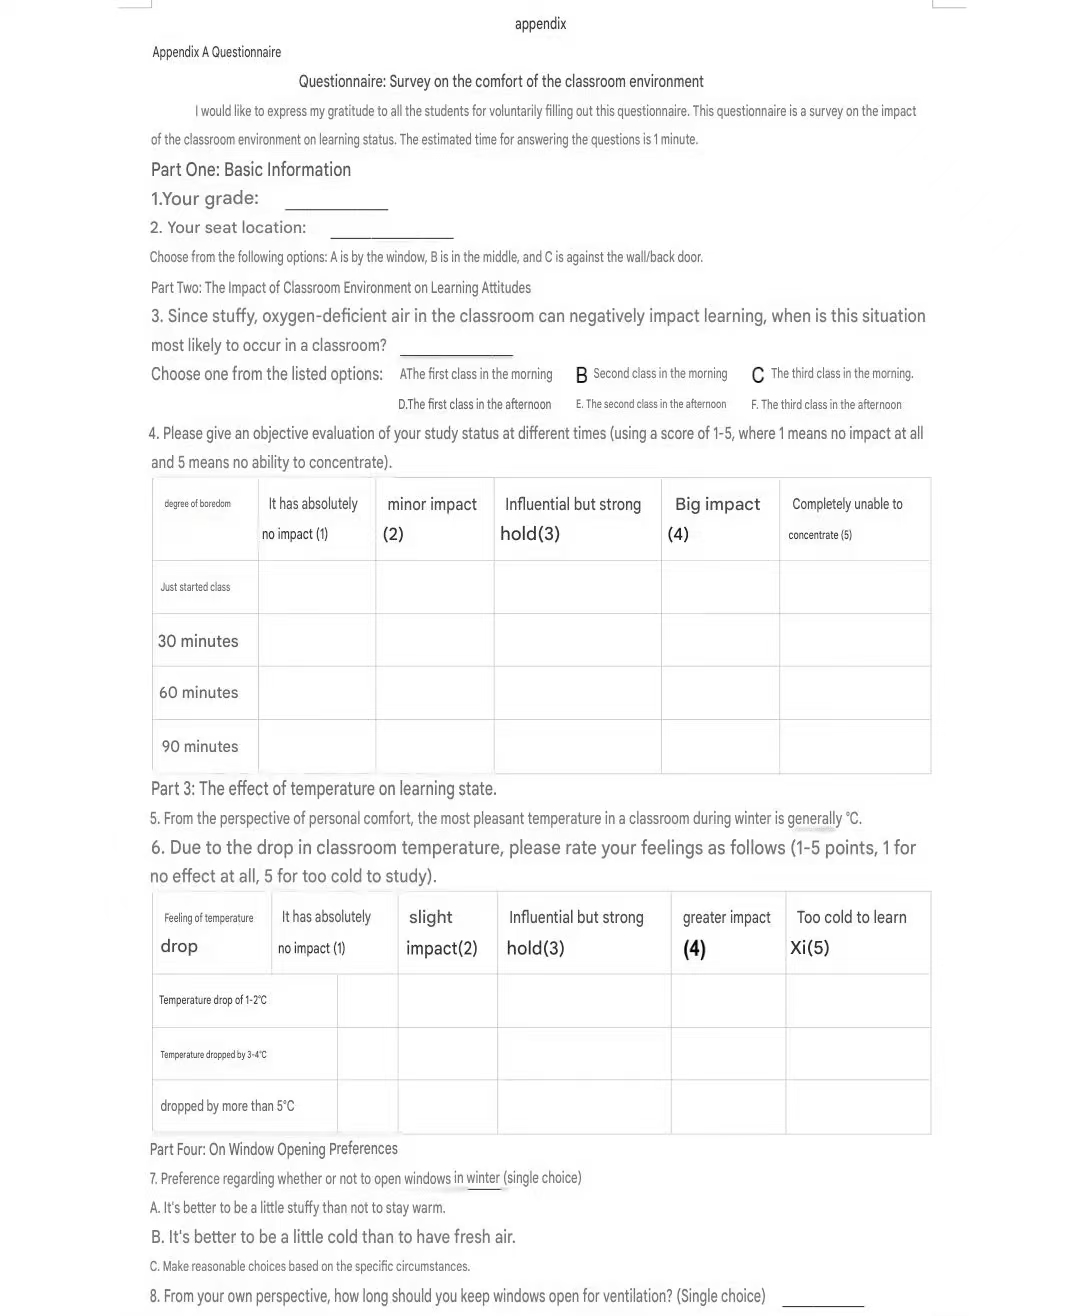
Figure 6: Field questionnaire on classroom environment and subjective comfort distribution.
Why I Used Dynamic Programming
I learned about dynamic programming when I was studying Python. I thought it could be useful for this problem.
Ventilation is not one decision. You make many of them during the day: open the window during class, during a short break, during a long break, or not at all.
One choice also shapes the next. Open the windows too long and the room gets so cold you will not want to open them again soon. Keep them shut all day and CO₂ climbs too high later.
Because of this, I used dynamic programming to find the best sequence of decisions.
I started from the end of the school day. I set the penalty after school as zero, and then used backward calculation to find the best decision for each earlier period. This way, the model could look at not only the current condition, but also the influence on later classes.
The Solution
The dynamic programming approach worked like this:
First, I discretized the school day into 5-minute intervals from 8:00 AM to 5:00 PM. Each interval could be in one of four states: fully closed, slightly open, half open, or fully open.
For each state, I calculated the cost based on two factors: how far the CO₂ concentration was from the ideal level, and how far the temperature was from the comfortable range. The total cost was the sum of these two penalties, weighted by the questionnaire results.
Then I used backward induction, starting from the last interval of the day and working backward. For each interval, I found the window state that minimized the total cost from that point to the end of the day.
The best plan had a pattern: open the windows wide during breaks when the room was nearly empty, and keep them mostly closed during class when people needed warmth. The exact timing depended on the weather outside and how long the break was.
MATLAB Simulation
After building the model, I used MATLAB to do the calculation.
I simulated a full school day from 8:00 AM to 5:00 PM. The model divided the day into 5-minute intervals. For each interval, it chose the best window state: fully closed, slightly open, half open, or fully open.
The numbers were clear: the optimized strategy beat both keeping the windows closed all day and leaving them open all day. The CO₂ concentration stayed lower, and the temperature did not drop too much.
Competition Experience
The competition was a great experience. I learned how to apply mathematical modeling to real-world problems, and I also learned how to present my work to judges.
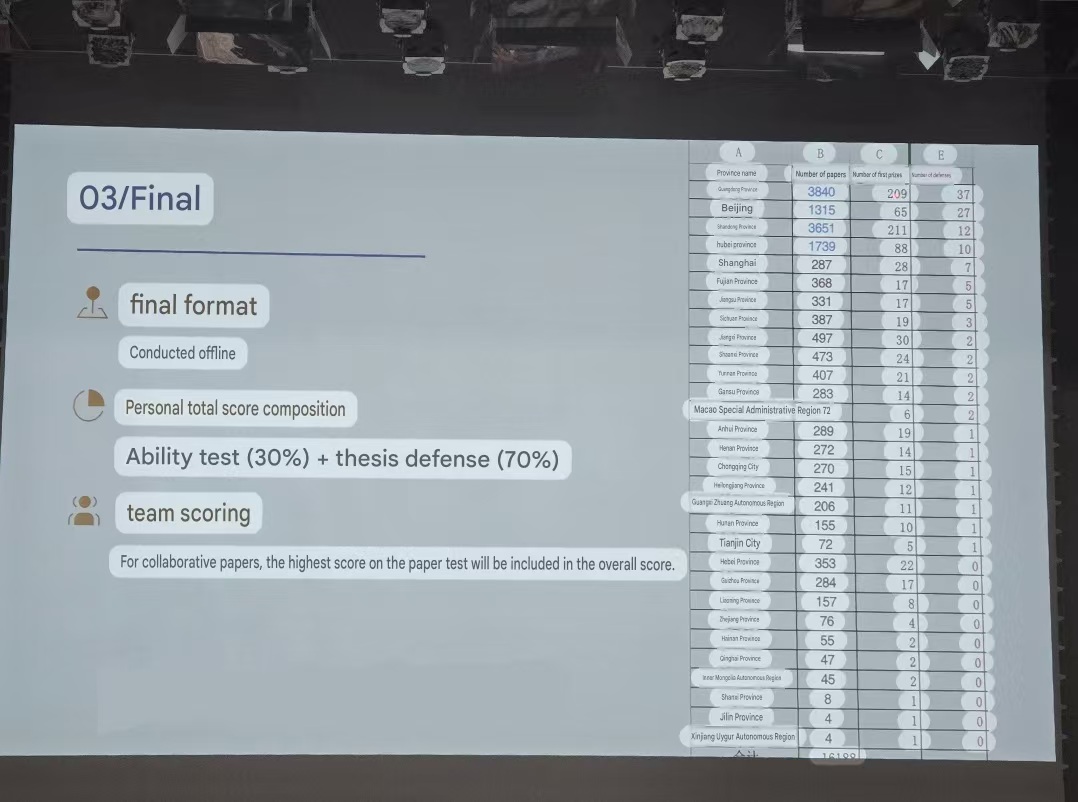
Figure 7: National finals competition overview and participation scope.
Most importantly, I learned that the best problems to solve are the ones you can see from where you stand. My classroom was stuffy every afternoon. That was my problem.
← Back to Home